Introduction to Statistics
TiDB uses statistics as input to the optimizer to estimate the number of rows processed in each plan step for a SQL statement. The optimizer estimates the cost of each available plan choice, including index accesses and the sequence of table joins, and produces a cost for each available plan. The optimizer then picks the execution plan with the lowest overall cost.
Collect statistics
This section describes two ways of collecting statistics: automatic update and manual collection.
Automatic update
For the INSERT, DELETE, or UPDATE statements, TiDB automatically updates the number of rows and modified rows in statistics.
TiDB persists the update information regularly and the update cycle is 20 * stats-lease. The default value of stats-lease is 3s. If you specify the value as 0, TiDB stops updating statistics automatically.
Based upon the number of changes to a table, TiDB will automatically schedule ANALYZE to collect statistics on those tables. This is controlled by the following system variables.
When the ratio of the number of modified rows to the total number of rows of tbl in a table is greater than tidb_auto_analyze_ratio, and the current time is between tidb_auto_analyze_start_time and tidb_auto_analyze_end_time, TiDB executes the ANALYZE TABLE tbl statement in the background to automatically update the statistics on this table.
To avoid the situation that modifying data on a small table frequently triggers the automatic update, when a table has less than 1000 rows, modifications do not trigger the automatic update in TiDB. You can use the SHOW STATS_META statement to view the number of rows in a table.
Manual collection
Currently, TiDB collects statistics as a full collection. You can execute the ANALYZE TABLE statement to collect statistics.
You can perform full collection using the following syntax.
To collect statistics of all the tables in
TableNameList:ANALYZE TABLE TableNameList [WITH NUM BUCKETS|TOPN|CMSKETCH DEPTH|CMSKETCH WIDTH]|[WITH NUM SAMPLES|WITH FLOATNUM SAMPLERATE];WITH NUM BUCKETSspecifies the maximum number of buckets in the generated histogram.WITH NUM TOPNspecifies the maximum number of the generatedTOPNs.WITH NUM CMSKETCH DEPTHspecifies the depth of the CM Sketch.WITH NUM CMSKETCH WIDTHspecifies the width of the CM Sketch.WITH NUM SAMPLESspecifies the number of samples.WITH FLOAT_NUM SAMPLERATEspecifies the sampling rate.
WITH NUM SAMPLES and WITH FLOAT_NUM SAMPLERATE correspond to two different algorithms of collecting samples.
See Histograms, Top-N and CMSketch (Count-Min Sketch) for detailed explanations. For SAMPLES/SAMPLERATE, see Improve collection performance.
For information on persisting the options for easier reuse, see Persist ANALYZE configurations.
Types of statistics
This section describes three types of statistics: histogram, Count-Min Sketch, and Top-N.
Histogram
Histogram statistics are used by the optimizer to estimate selectivity of an interval or range predicate, and might also be used to determine the number of distinct values within a column for estimation of equal/IN predicates in Version 2 of statistics (refer to Versions of Statistics).
A histogram is an approximate representation of the distribution of data. It divides the entire range of values into a series of buckets, and uses simple data to describe each bucket, such as the number of values falling in the bucket. In TiDB, an equal-depth histogram is created for the specific columns of each table. The equal-depth histogram can be used to estimate the interval query.
Here "equal-depth" means that the number of values falling into each bucket is as equal as possible. For example, for a given set {1.6, 1.9, 1.9, 2.0, 2.4, 2.6, 2.7, 2.7, 2.8, 2.9, 3.4, 3.5}, you want to generate 4 buckets. The equal-depth histogram is as follows. It contains four buckets [1.6, 1.9], [2.0, 2.6], [2.7, 2.8], [2.9, 3.5]. The bucket depth is 3.
For details about the parameter that determines the upper limit to the number of histogram buckets, refer to Manual Collection. When the number of buckets is larger, the accuracy of the histogram is higher; however, higher accuracy is at the cost of the usage of memory resources. You can adjust this number appropriately according to the actual scenario.
Count-Min Sketch
Count-Min Sketch is a hash structure. When processing an equivalence query such as a = 1 or an IN query (for example, a IN (1, 2, 3)), TiDB uses this data structure for estimation.
A hash collision might occur since Count-Min Sketch is a hash structure. In the EXPLAIN statement, if the estimate of the equivalent query deviates greatly from the actual value, it can be considered that a larger value and a smaller value have been hashed together. In this case, you can take one of the following ways to avoid the hash collision:
- Modify the
WITH NUM TOPNparameter. TiDB stores the high-frequency (top x) data separately, with the other data stored in Count-Min Sketch. Therefore, to prevent a larger value and a smaller value from being hashed together, you can increase the value ofWITH NUM TOPN. In TiDB, its default value is 20. The maximum value is 1024. For more information about this parameter, see Manual collection. - Modify two parameters
WITH NUM CMSKETCH DEPTHandWITH NUM CMSKETCH WIDTH. Both affect the number of hash buckets and the collision probability. You can increase the values of the two parameters appropriately according to the actual scenario to reduce the probability of hash collision, but at the cost of higher memory usage of statistics. In TiDB, the default value ofWITH NUM CMSKETCH DEPTHis 5, and the default value ofWITH NUM CMSKETCH WIDTHis 2048. For more information about the two parameters, see Manual collection.
Top-N
Top-N values are values with the top N occurrences in a column or index. Top-N statistics are often referred to as frequency statistics or data skew.
TiDB records the values and occurrences of Top-N values. Here N is controlled by the WITH NUM TOPN parameter. The default value is 20, meaning the top 20 most frequent values are collected. The maximum value is 1024. For details about the parameter, see Manual collection.
Selective statistics collection
This section describes how to collect statistics selectively.
Collect statistics on indexes
To collect statistics on all indexes in IndexNameList in TableName, use the following syntax:
ANALYZE TABLE TableName INDEX [IndexNameList] [WITH NUM BUCKETS|TOPN|CMSKETCH DEPTH|CMSKETCH WIDTH]|[WITH NUM SAMPLES|WITH FLOATNUM SAMPLERATE];
When IndexNameList is empty, this syntax collects statistics on all indexes in TableName.
Collect statistics on some columns
When TiDB executes SQL statements, the optimizer uses statistics for only a subset of columns in most cases. For example, columns that appear in the WHERE, JOIN, ORDER BY, and GROUP BY clauses. These columns are referred to as predicate columns.
If a table has many columns, collecting statistics on all the columns can cause a large overhead. To reduce the overhead, you can collect statistics for only specific columns (that you choose) or PREDICATE COLUMNS to be used by the optimizer. To persist the column list of any subset of columns for reuse in future, see Persist column configurations.
To collect statistics on specific columns, use the following syntax:
ANALYZE TABLE TableName COLUMNS ColumnNameList [WITH NUM BUCKETS|TOPN|CMSKETCH DEPTH|CMSKETCH WIDTH]|[WITH NUM SAMPLES|WITH FLOATNUM SAMPLERATE];In the syntax,
ColumnNameListspecifies the name list of the target columns. If you need to specify more than one column, use comma,to separate the column names. For example,ANALYZE table t columns a, b. Besides collecting statistics on the specific columns in a specific table, this syntax collects statistics on the indexed columns and all indexes in that table at the same time.To collect statistics on
PREDICATE COLUMNS, use the following syntax:ANALYZE TABLE TableName PREDICATE COLUMNS [WITH NUM BUCKETS|TOPN|CMSKETCH DEPTH|CMSKETCH WIDTH]|[WITH NUM SAMPLES|WITH FLOATNUM SAMPLERATE];TiDB always writes the
PREDICATE COLUMNSinformation to themysql.column_stats_usagesystem table every 100 *stats-lease.In addition to collecting statistics on
PREDICATE COLUMNSin a specific table, this syntax collects statistics on indexed columns and all indexes in that table at the same time.To collect statistics on all columns and indexes, use the following syntax:
ANALYZE TABLE TableName ALL COLUMNS [WITH NUM BUCKETS|TOPN|CMSKETCH DEPTH|CMSKETCH WIDTH]|[WITH NUM SAMPLES|WITH FLOATNUM SAMPLERATE];
Collect statistics on partitions
To collect statistics on all partitions in
PartitionNameListinTableName, use the following syntax:ANALYZE TABLE TableName PARTITION PartitionNameList [WITH NUM BUCKETS|TOPN|CMSKETCH DEPTH|CMSKETCH WIDTH]|[WITH NUM SAMPLES|WITH FLOATNUM SAMPLERATE];To collect index statistics on all partitions in
PartitionNameListinTableName, use the following syntax:ANALYZE TABLE TableName PARTITION PartitionNameList INDEX [IndexNameList] [WITH NUM BUCKETS|TOPN|CMSKETCH DEPTH|CMSKETCH WIDTH]|[WITH NUM SAMPLES|WITH FLOATNUM SAMPLERATE];If you only need to collect statistics on some columns of some partitions in a table, use the following syntax:
ANALYZE TABLE TableName PARTITION PartitionNameList [COLUMNS ColumnNameList|PREDICATE COLUMNS|ALL COLUMNS] [WITH NUM BUCKETS|TOPN|CMSKETCH DEPTH|CMSKETCH WIDTH]|[WITH NUM SAMPLES|WITH FLOATNUM SAMPLERATE];
Collect statistics of partitioned tables in dynamic pruning mode
When accessing partitioned tables in dynamic pruning mode (which is the default since v6.3.0), TiDB collects table-level statistics, meaning global statistics of partitioned tables. Currently, global statistics are aggregated from statistics of all partitions. In dynamic pruning mode, an update to the statistics in any partition of a table can trigger an update to the global statistics for that table.
If the statistics of some partitions are empty, or statistics of some columns are missing in some partitions, then the collection behavior is controlled by the tidb_skip_missing_partition_stats variable:
When an update to the global statistics is triggered and
tidb_skip_missing_partition_statsisOFF:If some partitions have no statistics (such as a new partition that has never been analyzed), global statistics generation is interrupted and a warning message is displayed saying that no statistics are available on partitions.
If statistics of some columns are absent in specific partitions (different columns are specified for analyzing in these partitions), global statistics generation is interrupted when statistics of these columns are aggregated, and a warning message is displayed saying that statistics of some columns are absent in specific partitions.
When an update to the global statistics is triggered and
tidb_skip_missing_partition_statsisON:- If statistics of all or some columns are missing for some partitions, TiDB skips these missing partition statistics when generating global statistics so the generation of global statistics is not affected.
In dynamic pruning mode, the ANALYZE configurations of partitions and tables should be the same. Therefore, if you specify the COLUMNS configuration following the ANALYZE TABLE TableName PARTITION PartitionNameList statement or the OPTIONS configuration following WITH, TiDB will ignore them and return a warning.
Improve collection performance
TiDB provides two options to improve the performance of statistics collection:
- Collecting statistics on a subset of the columns. See Collecting statistics on some columns.
- Sampling.
Statistics sampling
Sampling is available via two separate options of the ANALYZE statement - with each corresponding to a different collection algorithm:
WITH NUM SAMPLESspecifies the size of the sampling set, which is implemented in the reservoir sampling method in TiDB. When a table is large, it is not recommended to use this method to collect statistics. Because the intermediate result set of the reservoir sampling contains redundant results, it causes additional pressure on resources such as memory.WITH FLOAT_NUM SAMPLERATEis a sampling method introduced in v5.3.0. With the value range(0, 1], this parameter specifies the sampling rate. It is implemented in the way of Bernoulli sampling in TiDB, which is more suitable for sampling larger tables and performs better in collection efficiency and resource usage.
Before v5.3.0, TiDB uses the reservoir sampling method to collect statistics. Since v5.3.0, the TiDB Version 2 statistics uses the Bernoulli sampling method to collect statistics by default. To re-use the reservoir sampling method, you can use the WITH NUM SAMPLES statement.
The current sampling rate is calculated based on an adaptive algorithm. When you can observe the number of rows in a table using SHOW STATS_META, you can use this number of rows to calculate the sampling rate corresponding to 100,000 rows. If you cannot observe this number, you can use the sum of all the values in the APPROXIMATE_KEYS column in the results of SHOW TABLE REGIONS of the table as another reference to calculate the sampling rate.
The memory quota for collecting statistics
Since TiDB v6.1.0, you can use the system variable tidb_mem_quota_analyze to control the memory quota for collecting statistics in TiDB.
To set a proper value of tidb_mem_quota_analyze, consider the data size of the cluster. When the default sampling rate is used, the main considerations are the number of columns, the size of column values, and the memory configuration of TiDB. Consider the following suggestions when you configure the maximum and minimum values:
- Minimum value: should be greater than the maximum memory usage when TiDB collects statistics from the table with the most columns. An approximate reference: when TiDB collects statistics from a table with 20 columns using the default configuration, the maximum memory usage is about 800 MiB; when TiDB collects statistics from a table with 160 columns using the default configuration, the maximum memory usage is about 5 GiB.
- Maximum value: should be less than the available memory when TiDB is not collecting statistics.
Persist ANALYZE configurations
Since v5.4.0, TiDB supports persisting some ANALYZE configurations. With this feature, the existing configurations can be easily reused for future statistics collection.
The following are the ANALYZE configurations that support persistence:
Enable ANALYZE configuration persistence
The ANALYZE configuration persistence feature is enabled by default (the system variable tidb_analyze_version is 2 and tidb_persist_analyze_options is ON by default).
You can use this feature to record the persistence configurations specified in the ANALYZE statement when executing the statement manually. Once recorded, the next time TiDB automatically updates statistics or you manually collect statistics without specifying these configuration, TiDB will collect statistics according to the recorded configurations.
To query the configuration persisted on a specific table used for auto analyze operations, you can use the following SQL statement:
SELECT sample_num, sample_rate, buckets, topn, column_choice, column_ids FROM mysql.analyze_options opt JOIN information_schema.tables tbl ON opt.table_id = tbl.tidb_table_id WHERE tbl.table_schema = '{db_name}' AND tbl.table_name = '{table_name}';
TiDB will overwrite the previously recorded persistent configuration using the new configurations specified by the latest ANALYZE statement. For example, if you run ANALYZE TABLE t WITH 200 TOPN;, it will set the top 200 values in the ANALYZE statement. Subsequently, executing ANALYZE TABLE t WITH 0.1 SAMPLERATE; will set both the top 200 values and a sampling rate of 0.1 for auto ANALYZE statements, similar to ANALYZE TABLE t WITH 200 TOPN, 0.1 SAMPLERATE;.
Disable ANALYZE configuration persistence
To disable the ANALYZE configuration persistence feature, set the tidb_persist_analyze_options system variable to OFF. Because the ANALYZE configuration persistence feature is not applicable to tidb_analyze_version = 1, setting tidb_analyze_version = 1 can also disable the feature.
After disabling the ANALYZE configuration persistence feature, TiDB does not clear the persisted configuration records. Therefore, if you enable this feature again, TiDB continues to collect statistics using the previously recorded persistent configurations.
Persist column configurations
If you want to persist the column configuration in the ANALYZE statement (including COLUMNS ColumnNameList, PREDICATE COLUMNS, and ALL COLUMNS), set the value of the tidb_persist_analyze_options system variable to ON to enable the ANALYZE configuration persistence feature. After enabling the ANALYZE configuration persistence feature:
- When TiDB collects statistics automatically or when you manually collect statistics by executing the
ANALYZEstatement without specifying the column configuration, TiDB continues using the previously persisted configuration for statistics collection. - When you manually execute the
ANALYZEstatement multiple times with column configuration specified, TiDB overwrites the previously recorded persistent configuration using the new configuration specified by the latestANALYZEstatement.
To locate PREDICATE COLUMNS and columns on which statistics have been collected, use the SHOW COLUMN_STATS_USAGE statement.
In the following example, after executing ANALYZE TABLE t PREDICATE COLUMNS;, TiDB collects statistics on columns b, c, and d, where column b is a PREDICATE COLUMN and columns c and d are index columns.
CREATE TABLE t (a INT, b INT, c INT, d INT, INDEX idx_c_d(c, d));
Query OK, 0 rows affected (0.00 sec)

-- The optimizer uses the statistics on column b in this query.
SELECT * FROM t WHERE b > 1;
Empty set (0.00 sec)

-- After waiting for a period of time (100 * stats-lease), TiDB writes the collected `PREDICATE COLUMNS` to mysql.column_stats_usage.
-- Specify `last_used_at IS NOT NULL` to show the `PREDICATE COLUMNS` collected by TiDB.
SHOW COLUMN_STATS_USAGE
WHERE db_name = 'test' AND table_name = 't' AND last_used_at IS NOT NULL;
+---------+------------+----------------+-------------+---------------------+------------------+
| Db_name | Table_name | Partition_name | Column_name | Last_used_at        | Last_analyzed_at |
+---------+------------+----------------+-------------+---------------------+------------------+
| test    | t          |                | b           | 2022-01-05 17:21:33 | NULL             |
+---------+------------+----------------+-------------+---------------------+------------------+
1 row in set (0.00 sec)

ANALYZE TABLE t PREDICATE COLUMNS;
Query OK, 0 rows affected, 1 warning (0.03 sec)

-- Specify `last_analyzed_at IS NOT NULL` to show the columns for which statistics have been collected.
SHOW COLUMN_STATS_USAGE
WHERE db_name = 'test' AND table_name = 't' AND last_analyzed_at IS NOT NULL;
+---------+------------+----------------+-------------+---------------------+---------------------+
| Db_name | Table_name | Partition_name | Column_name | Last_used_at        | Last_analyzed_at    |
+---------+------------+----------------+-------------+---------------------+---------------------+
| test    | t          |                | b           | 2022-01-05 17:21:33 | 2022-01-05 17:23:06 |
| test    | t          |                | c           | NULL                | 2022-01-05 17:23:06 |
| test    | t          |                | d           | NULL                | 2022-01-05 17:23:06 |
+---------+------------+----------------+-------------+---------------------+---------------------+
3 rows in set (0.00 sec)
Versions of statistics
The tidb_analyze_version variable controls the statistics collected by TiDB. Currently, two versions of statistics are supported: tidb_analyze_version = 1 and tidb_analyze_version = 2.
- For TiDB Self-Managed, the default value of this variable changes from
1to2starting from v5.3.0. - For TiDB Cloud, the default value of this variable changes from
1to2starting from v6.5.0. - If your cluster is upgraded from an earlier version, the default value of
tidb_analyze_versiondoes not change after the upgrade.
Version 2 is preferred, and will continue to be enhanced to ultimately replace Version 1 completely. Compared to Version 1, Version 2 improves the accuracy of many of the statistics collected for larger data volumes. Version 2 also improves collection performance by removing the need to collect Count-Min sketch statistics for predicate selectivity estimation, and also supporting automated collection only on selected columns (see Collecting statistics on some columns).
The following table lists the information collected by each version for usage in the optimizer estimates:
Switch between statistics versions
It is recommended to ensure that all tables/indexes (and partitions) utilize statistics collection from the same version. Version 2 is recommended, however, it is not recommended to switch from one version to another without a justifiable reason such as an issue experienced with the version in use. A switch between versions might take a period of time when no statistics are available until all tables have been analyzed with the new version, which might negatively affect the optimizer plan choices if statistics are not available.
Examples of justifications to switch might include - with Version 1, there could be inaccuracies in equal/IN predicate estimation due to hash collisions when collecting Count-Min sketch statistics. Solutions are listed in the Count-Min Sketch section. Alternatively, setting tidb_analyze_version = 2 and rerunning ANALYZE on all objects is also a solution. In the early release of Version 2, there was a risk of memory overflow after ANALYZE. This issue is resolved, but initially, one solution was to set tidb_analyze_version = 1 and rerun ANALYZE on all objects.
To prepare ANALYZE for switching between versions:
If the
ANALYZEstatement is executed manually, manually analyze every table to be analyzed.SELECT DISTINCT(CONCAT('ANALYZE TABLE ', table_schema, '.', table_name, ';')) FROM information_schema.tables JOIN mysql.stats_histograms ON table_id = tidb_table_id WHERE stats_ver = 2;If TiDB automatically executes the
ANALYZEstatement because the auto-analysis has been enabled, execute the following statement that generates theDROP STATSstatement:SELECT DISTINCT(CONCAT('DROP STATS ', table_schema, '.', table_name, ';')) FROM information_schema.tables JOIN mysql.stats_histograms ON table_id = tidb_table_id WHERE stats_ver = 2;If the result of the preceding statement is too long to copy and paste, you can export the result to a temporary text file and then perform execution from the file like this:
SELECT DISTINCT ... INTO OUTFILE '/tmp/sql.txt';
mysql -h ${TiDB_IP} -u user -P ${TIDB_PORT} ... < '/tmp/sql.txt'
View statistics
You can view the ANALYZE status and statistics information using the following statements.
ANALYZE state
When executing the ANALYZE statement, you can view the current state of ANALYZE using SHOW ANALYZE STATUS.
Starting from TiDB v6.1.0, the SHOW ANALYZE STATUS statement supports showing cluster-level tasks. Even after a TiDB restart, you can still view task records before the restart using this statement. Before TiDB v6.1.0, the SHOW ANALYZE STATUS statement can only show instance-level tasks, and task records are cleared after a TiDB restart.
SHOW ANALYZE STATUS shows the most recent task records only. Starting from TiDB v6.1.0, you can view the history tasks within the last 7 days through the system table mysql.analyze_jobs.
When tidb_mem_quota_analyze is set and an automatic ANALYZE task running in the TiDB background uses more memory than this threshold, the task will be retried. You can see failed and retried tasks in the output of the SHOW ANALYZE STATUS statement.
When tidb_max_auto_analyze_time is greater than 0 and an automatic ANALYZE task running in the TiDB background takes more time than this threshold, the task will be terminated.
mysql> SHOW ANALYZE STATUS [ShowLikeOrWhere];
+--------------+------------+----------------+-------------------------------------------------------------------------------------------+----------------+---------------------+---------------------+----------+-------------------------------------------------------------------------------|
| Table_schema | Table_name | Partition_name | Job_info                                                                                  | Processed_rows | Start_time          | End_time            | State    | Fail_reason                                                                   |
+--------------+------------+----------------+-------------------------------------------------------------------------------------------+----------------+---------------------+---------------------+----------+-------------------------------------------------------------------------------|
| test         | sbtest1    |                | retry auto analyze table all columns with 100 topn, 0.055 samplerate                      |        2000000 | 2022-05-07 16:41:09 | 2022-05-07 16:41:20 | finished | NULL                                                                          |
| test         | sbtest1    |                | auto analyze table all columns with 100 topn, 0.5 samplerate                              |              0 | 2022-05-07 16:40:50 | 2022-05-07 16:41:09 | failed   | analyze panic due to memory quota exceeds, please try with smaller samplerate |
Metadata of tables
You can use the SHOW STATS_META statement to view the total number of rows and the number of updated rows.
Health state of tables
You can use the SHOW STATS_HEALTHY statement to check the health state of tables and roughly estimate the accuracy of the statistics. When modify_count >= row_count, the health state is 0; when modify_count < row_count, the health state is (1 - modify_count/row_count) * 100.
Metadata of columns
You can use the SHOW STATS_HISTOGRAMS statement to view the number of different values and the number of NULL in all the columns.
Buckets of histogram
You can use the SHOW STATS_BUCKETS statement to view each bucket of the histogram.
Top-N information
You can use the SHOW STATS_TOPN statement to view the Top-N information currently collected by TiDB.
Delete statistics
You can run the DROP STATS statement to delete statistics.
Load statistics
By default, depending on the size of column statistics, TiDB loads statistics differently as follows:
- For statistics that consume small amounts of memory (such as count, distinctCount, and nullCount), as long as the column data is updated, TiDB automatically loads the corresponding statistics into memory for use in the SQL optimization stage.
- For statistics that consume large amounts of memory (such as histograms, TopN, and Count-Min Sketch), to ensure the performance of SQL execution, TiDB loads the statistics asynchronously on demand. Take histograms as an example. TiDB loads histogram statistics on a column into memory only when the optimizer uses the histogram statistics on that column. On-demand asynchronous statistics loading does not affect the performance of SQL execution but might provide incomplete statistics for SQL optimization.
Since v5.4.0, TiDB introduces the synchronously loading statistics feature. This feature allows TiDB to synchronously load large-sized statistics (such as histograms, TopN, and Count-Min Sketch statistics) into memory when you execute SQL statements, which improves the completeness of statistics for SQL optimization.
To enable this feature, set the value of the tidb_stats_load_sync_wait system variable to a timeout (in milliseconds) that SQL optimization can wait for at most to synchronously load complete column statistics. The default value of this variable is 100, indicating that the feature is enabled.
After enabling the synchronously loading statistics feature, you can further configure the feature as follows:
- To control how TiDB behaves when the waiting time of SQL optimization reaches the timeout, modify the value of the
tidb_stats_load_pseudo_timeoutsystem variable. The default value of this variable isON, indicating that after the timeout, the SQL optimization process does not use any histogram, TopN, or CMSketch statistics on any columns. If this variable is set toOFF, after the timeout, SQL execution fails. - To specify the maximum number of columns that the synchronously loading statistics feature can process concurrently, modify the value of the
stats-load-concurrencyoption in the TiDB configuration file. Starting from v8.2.0, the default value of this option is0, indicating that TiDB automatically adjusts concurrency based on the server configuration. - To specify the maximum number of column requests that the synchronously loading statistics feature can cache, modify the value of the
stats-load-queue-sizeoption in the TiDB configuration file. The default value is1000.
During TiDB startup, SQL statements executed before the initial statistics are fully loaded might have suboptimal execution plans, thus causing performance issues. To avoid such issues, TiDB v7.1.0 introduces the configuration parameter force-init-stats. With this option, you can control whether TiDB provides services only after statistics initialization has been finished during startup. Starting from v7.2.0, this parameter is enabled by default.
Starting from v7.1.0, TiDB introduces lite-init-stats for lightweight statistics initialization.
- When the value of
lite-init-statsistrue, statistics initialization does not load any histogram, TopN, or Count-Min Sketch of indexes or columns into memory. - When the value of
lite-init-statsisfalse, statistics initialization loads histograms, TopN, and Count-Min Sketch of indexes and primary keys into memory but does not load any histogram, TopN, or Count-Min Sketch of non-primary key columns into memory. When the optimizer needs the histogram, TopN, and Count-Min Sketch of a specific index or column, the necessary statistics are loaded into memory synchronously or asynchronously.
The default value of lite-init-stats is true, which means to enable lightweight statistics initialization. Setting lite-init-stats to true speeds up statistics initialization and reduces TiDB memory usage by avoiding unnecessary statistics loading.
Export and import statistics
This section describes how to export and import statistics.
Export statistics
The interface to export statistics is as follows:
To obtain the JSON format statistics of the
${table_name}table in the${db_name}database:http://${tidb-server-ip}:${tidb-server-status-port}/stats/dump/${db_name}/${table_name}For example:
curl -s http://127.0.0.1:10080/stats/dump/test/t1 -o /tmp/t1.jsonTo obtain the JSON format statistics of the
${table_name}table in the${db_name}database at specific time:http://${tidb-server-ip}:${tidb-server-status-port}/stats/dump/${db_name}/${table_name}/${yyyyMMddHHmmss}
Import statistics
Generally, the imported statistics refer to the JSON file obtained using the export interface.
Loading statistics can be done with the LOAD STATS statement.
For example:
LOAD STATS 'file_name';
file_name is the file name of the statistics to be imported.
Lock statistics
Starting from v6.5.0, TiDB supports locking statistics. After the statistics of a table or a partition are locked, the statistics of the table cannot be modified and the ANALYZE statement cannot be executed on the table. For example:
Create table t, and insert data into it. When the statistics of table t are not locked, the ANALYZE statement can be successfully executed.
mysql> CREATE TABLE t(a INT, b INT);
Query OK, 0 rows affected (0.03 sec)

mysql> INSERT INTO t VALUES (1,2), (3,4), (5,6), (7,8);
Query OK, 4 rows affected (0.00 sec)
Records: 4  Duplicates: 0  Warnings: 0

mysql> ANALYZE TABLE t;
Query OK, 0 rows affected, 1 warning (0.02 sec)

mysql> SHOW WARNINGS;
+-------+------+-----------------------------------------------------------------------------------------------------------------------------------------------------------------------------------------------------------------------+
| Level | Code | Message                                                                                                                                                                                                               |
+-------+------+-----------------------------------------------------------------------------------------------------------------------------------------------------------------------------------------------------------------------+
| Note  | 1105 | Analyze use auto adjusted sample rate 1.000000 for table test.t, reason to use this rate is "Row count in stats_meta is much smaller compared with the row count got by PD, use min(1, 15000/4) as the sample-rate=1" |
+-------+------+-----------------------------------------------------------------------------------------------------------------------------------------------------------------------------------------------------------------------+
1 row in set (0.00 sec)
Lock the statistics of table t and execute ANALYZE. The warning message shows that the ANALYZE statement has skipped table t.
mysql> LOCK STATS t;
Query OK, 0 rows affected (0.00 sec)

mysql> SHOW STATS_LOCKED;
+---------+------------+----------------+--------+
| Db_name | Table_name | Partition_name | Status |
+---------+------------+----------------+--------+
| test    | t          |                | locked |
+---------+------------+----------------+--------+
1 row in set (0.01 sec)

mysql> ANALYZE TABLE t;
Query OK, 0 rows affected, 2 warnings (0.00 sec)

mysql> SHOW WARNINGS;
+---------+------+-----------------------------------------------------------------------------------------------------------------------------------------+
| Level   | Code | Message                                                                                                                                 |
+---------+------+-----------------------------------------------------------------------------------------------------------------------------------------+
| Note    | 1105 | Analyze use auto adjusted sample rate 1.000000 for table test.t, reason to use this rate is "use min(1, 110000/8) as the sample-rate=1" |
| Warning | 1105 | skip analyze locked table: test.t                                                                                                       |
+---------+------+-----------------------------------------------------------------------------------------------------------------------------------------+
2 rows in set (0.00 sec)
Unlock the statistics of table t and ANALYZE can be successfully executed again.
mysql> UNLOCK STATS t;
Query OK, 0 rows affected (0.01 sec)

mysql> ANALYZE TABLE t;
Query OK, 0 rows affected, 1 warning (0.03 sec)

mysql> SHOW WARNINGS;
+-------+------+-----------------------------------------------------------------------------------------------------------------------------------------+
| Level | Code | Message                                                                                                                                 |
+-------+------+-----------------------------------------------------------------------------------------------------------------------------------------+
| Note  | 1105 | Analyze use auto adjusted sample rate 1.000000 for table test.t, reason to use this rate is "use min(1, 110000/8) as the sample-rate=1" |
+-------+------+-----------------------------------------------------------------------------------------------------------------------------------------+
1 row in set (0.00 sec)
In addition, you can also lock the statistics of a partition using LOCK STATS. For example:
Create a partition table t, and insert data into it. When the statistics of partition p1 are not locked, the ANALYZE statement can be successfully executed.
mysql> CREATE TABLE t(a INT, b INT) PARTITION BY RANGE (a) (PARTITION p0 VALUES LESS THAN (10), PARTITION p1 VALUES LESS THAN (20), PARTITION p2 VALUES LESS THAN (30));
Query OK, 0 rows affected (0.03 sec)

mysql> INSERT INTO t VALUES (1,2), (3,4), (5,6), (7,8);
Query OK, 4 rows affected (0.00 sec)
Records: 4  Duplicates: 0  Warnings: 0

mysql> ANALYZE TABLE t;
Query OK, 0 rows affected, 6 warning (0.02 sec)

mysql> SHOW WARNINGS;
+---------+------+--------------------------------------------------------------------------------------------------------------------------------------------------------------------------------------------------------------------------------------+
| Level   | Code | Message                                                                                                                                                                                                                              |
+---------+------+--------------------------------------------------------------------------------------------------------------------------------------------------------------------------------------------------------------------------------------+
| Warning | 1105 | disable dynamic pruning due to t has no global stats                                                                                                                                                                                 |
| Note    | 1105 | Analyze use auto adjusted sample rate 1.000000 for table test.t's partition p0, reason to use this rate is "Row count in stats_meta is much smaller compared with the row count got by PD, use min(1, 15000/4) as the sample-rate=1" |
| Warning | 1105 | disable dynamic pruning due to t has no global stats                                                                                                                                                                                 |
| Note    | 1105 | Analyze use auto adjusted sample rate 1.000000 for table test.t's partition p1, reason to use this rate is "TiDB assumes that the table is empty, use sample-rate=1"                                                                 |
| Warning | 1105 | disable dynamic pruning due to t has no global stats                                                                                                                                                                                 |
| Note    | 1105 | Analyze use auto adjusted sample rate 1.000000 for table test.t's partition p2, reason to use this rate is "TiDB assumes that the table is empty, use sample-rate=1"                                                                 |
+---------+------+--------------------------------------------------------------------------------------------------------------------------------------------------------------------------------------------------------------------------------------+
6 rows in set (0.01 sec)
Lock the statistics of partition p1 and execute ANALYZE. The warning message shows that the ANALYZE statement has skipped partition p1.
mysql> LOCK STATS t PARTITION p1;
Query OK, 0 rows affected (0.00 sec)

mysql> SHOW STATS_LOCKED;
+---------+------------+----------------+--------+
| Db_name | Table_name | Partition_name | Status |
+---------+------------+----------------+--------+
| test    | t          | p1             | locked |
+---------+------------+----------------+--------+
1 row in set (0.00 sec)

mysql> ANALYZE TABLE t PARTITION p1;
Query OK, 0 rows affected, 2 warnings (0.01 sec)

mysql> SHOW WARNINGS;
+---------+------+----------------------------------------------------------------------------------------------------------------------------------------------------------------------+
| Level   | Code | Message                                                                                                                                                              |
+---------+------+----------------------------------------------------------------------------------------------------------------------------------------------------------------------+
| Note    | 1105 | Analyze use auto adjusted sample rate 1.000000 for table test.t's partition p1, reason to use this rate is "TiDB assumes that the table is empty, use sample-rate=1" |
| Warning | 1105 | skip analyze locked table: test.t partition (p1)                                                                                                                     |
+---------+------+----------------------------------------------------------------------------------------------------------------------------------------------------------------------+
2 rows in set (0.00 sec)
Unlock the statistics of partition p1 and ANALYZE can be successfully executed again.
mysql> UNLOCK STATS t PARTITION p1;
Query OK, 0 rows affected (0.00 sec)

mysql> ANALYZE TABLE t PARTITION p1;
Query OK, 0 rows affected, 1 warning (0.01 sec)

mysql> SHOW WARNINGS;
+-------+------+----------------------------------------------------------------------------------------------------------------------------------------------------------------------+
| Level | Code | Message                                                                                                                                                              |
+-------+------+----------------------------------------------------------------------------------------------------------------------------------------------------------------------+
| Note  | 1105 | Analyze use auto adjusted sample rate 1.000000 for table test.t's partition p1, reason to use this rate is "TiDB assumes that the table is empty, use sample-rate=1" |
+-------+------+----------------------------------------------------------------------------------------------------------------------------------------------------------------------+
1 row in set (0.00 sec)
Behaviors of locking statistics
- If you lock the statistics on a partitioned table, the statistics of all partitions on the partitioned table are locked.
- If you truncate a table or partition, the statistics lock on the table or partition will be released.
The following table describes the behaviors of locking statistics:
Manage ANALYZE tasks and concurrency
This section describes how to terminate background ANALYZE tasks and control the ANALYZE concurrency.
Terminate background ANALYZE tasks
Since TiDB v6.0, TiDB supports using the KILL statement to terminate an ANALYZE task running in the background. If you find that an ANALYZE task running in the background consumes a lot of resources and affects your application, you can terminate the ANALYZE task by taking the following steps:
Execute the following SQL statement:
SHOW ANALYZE STATUSBy checking the
instancecolumn and theprocess_idcolumn in the result, you can get the TiDB instance address and the taskIDof the backgroundANALYZEtask.Terminate the
ANALYZEtask that is running in the background.- If
enable-global-killistrue(trueby default), you can execute theKILL TIDB ${id};statement directly, where${id}is theIDof the backgroundANALYZEtask obtained from the previous step. - If
enable-global-killisfalse, you need to use a client to connect to the TiDB instance that is executing the backendANALYZEtask, and then execute theKILL TIDB ${id};statement. If you use a client to connect to another TiDB instance, or if there is a proxy between the client and the TiDB cluster, theKILLstatement cannot terminate the backgroundANALYZEtask.
- If
For more information on the KILL statement, see KILL.
Control ANALYZE concurrency
When you run the ANALYZE statement, you can adjust the concurrency using system variables, to control its effect on the system.
The relationships of the relevant system variables are shown below:
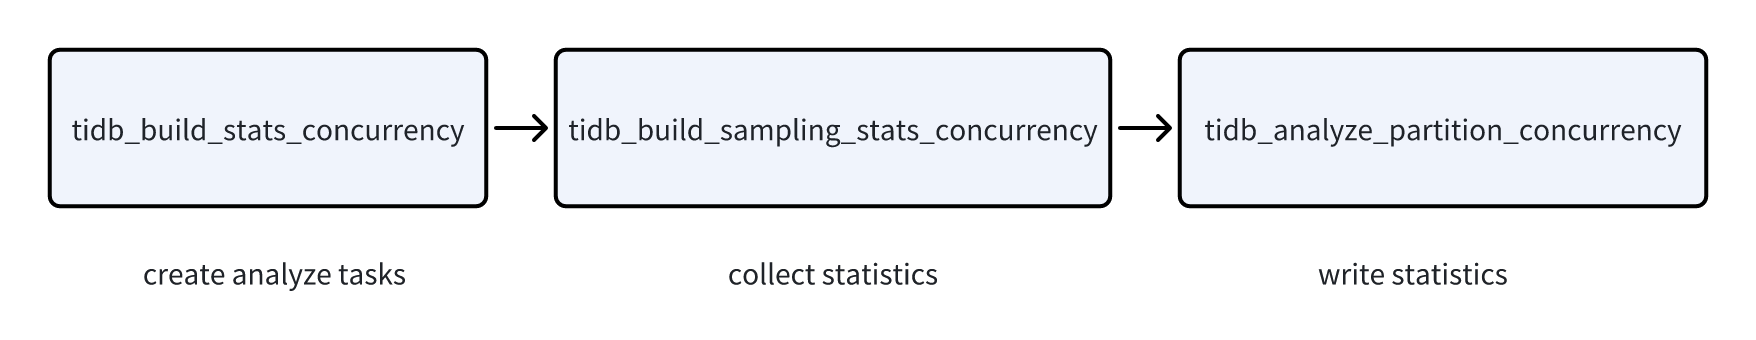
tidb_build_stats_concurrency, tidb_build_sampling_stats_concurrency, and tidb_analyze_partition_concurrency are in an upstream-downstream relationship, as shown in the preceding diagram. The actual total concurrency is: tidb_build_stats_concurrency * (tidb_build_sampling_stats_concurrency + tidb_analyze_partition_concurrency). When modifying these variables, you need to consider their respective values at the same time. It is recommended to adjust them one by one in the order of tidb_analyze_partition_concurrency, tidb_build_sampling_stats_concurrency, tidb_build_stats_concurrency, and observe the impact on the system. The larger the values of these three variables, the greater the resource overhead on the system.
tidb_build_stats_concurrency
This variable controls the concurrency for building statistics during manual ANALYZE, such as the number of table or partition analysis tasks that can be processed simultaneously. The default value is 2. The default value is 4 for v7.4.0 and earlier versions.
tidb_build_sampling_stats_concurrency
This variable controls the following aspects of ANALYZE concurrency:
- The concurrency for merging samples collected from different Regions.
- The concurrency for collecting statistics on special indexes (such as indexes on generated virtual columns), for example, the number of indexes that TiDB can concurrently collect statistics for.
The default value is 2.
tidb_analyze_partition_concurrency
This variable controls the concurrency for saving ANALYZE results (writing TopN and histograms to system tables). The default value is 2. The default value is 1 for v7.4.0 and earlier versions.
tidb_analyze_distsql_scan_concurrency
This variable controls the following aspects of ANALYZE concurrency:
- The concurrency of scanning TiKV Regions.
- The concurrency of scanning Regions for special indexes (indexes generated from virtual columns).
The default value is 4.