TiDB TPC-H 50G Performance Test Report
Test purpose
This test aims to compare the performances of TiDB 1.0 and TiDB 2.0 in the OLAP scenario.
Test environment
Machine information
System information:
| Machine IP | Operation system | Kernel version | File system type |
|---|---|---|---|
| 172.16.31.2 | Ubuntu 17.10 64bit | 4.13.0-16-generic | ext4 |
| 172.16.31.3 | Ubuntu 17.10 64bit | 4.13.0-16-generic | ext4 |
| 172.16.31.4 | Ubuntu 17.10 64bit | 4.13.0-16-generic | ext4 |
| 172.16.31.6 | CentOS 7.4.1708 64bit | 3.10.0-693.11.6.el7.x86_64 | ext4 |
| 172.16.31.8 | CentOS 7.4.1708 64bit | 3.10.0-693.11.6.el7.x86_64 | ext4 |
| 172.16.31.10 | CentOS 7.4.1708 64bit | 3.10.0-693.11.6.el7.x86_64 | ext4 |
Hardware information:
| Type | Name |
|---|---|
| CPU | 40 vCPUs, Intel(R) Xeon(R) CPU E5-2630 v4 @ 2.20GHz |
| RAM | 128GB, 16GB RDIMM * 8, 2400MT/s, dual channel, x8 bitwidth |
| DISK | Intel P4500 4T SSD * 2 |
| Network Card | 10 Gigabit Ethernet |
TPC-H
Cluster topology
| Machine IP | Deployment Instance |
|---|---|
| 172.16.31.2 | TiKV * 2 |
| 172.16.31.3 | TiKV * 2 |
| 172.16.31.6 | TiKV * 2 |
| 172.16.31.8 | TiKV * 2 |
| 172.16.31.10 | TiKV * 2 |
| 172.16.31.10 | PD * 1 |
| 172.16.31.4 | TiDB * 1 |
Corresponding TiDB version information
TiDB 1.0:
| Component | Version | Commit Hash |
|---|---|---|
| TiDB | v1.0.9 | 4c7ee3580cd0a69319b2c0c08abdc59900df7344 |
| TiKV | v1.0.8 | 2bb923a4cd23dbf68f0d16169fd526dc5c1a9f4a |
| PD | v1.0.8 | 137fa734472a76c509fbfd9cb9bc6d0dc804a3b7 |
TiDB 2.0:
| Component | Version | Commit Hash |
|---|---|---|
| TiDB | v2.0.0-rc.6 | 82d35f1b7f9047c478f4e1e82aa0002abc8107e7 |
| TiKV | v2.0.0-rc.6 | 8bd5c54966c6ef42578a27519bce4915c5b0c81f |
| PD | v2.0.0-rc.6 | 9b824d288126173a61ce7d51a71fc4cb12360201 |
Test result
| Query ID | TiDB 2.0 | TiDB 1.0 |
|---|---|---|
| 1 | 33.915s | 215.305s |
| 2 | 25.575s | Nan |
| 3 | 59.631s | 196.003s |
| 4 | 30.234s | 249.919s |
| 5 | 31.666s | OOM |
| 6 | 13.111s | 118.709s |
| 7 | 31.710s | OOM |
| 8 | 31.734s | 800.546s |
| 9 | 34.211s | 630.639s |
| 10 | 30.774s | 133.547s |
| 11 | 27.692s | 78.026s |
| 12 | 27.962s | 124.641s |
| 13 | 27.676s | 174.695s |
| 14 | 19.676s | 110.602s |
| 15 | NaN | Nan |
| 16 | 24.890s | 40.529s |
| 17 | 245.796s | NaN |
| 18 | 91.256s | OOM |
| 19 | 37.615s | NaN |
| 20 | 44.167s | 212.201s |
| 21 | 31.466s | OOM |
| 22 | 31.539s | 125.471s |

It should be noted that:
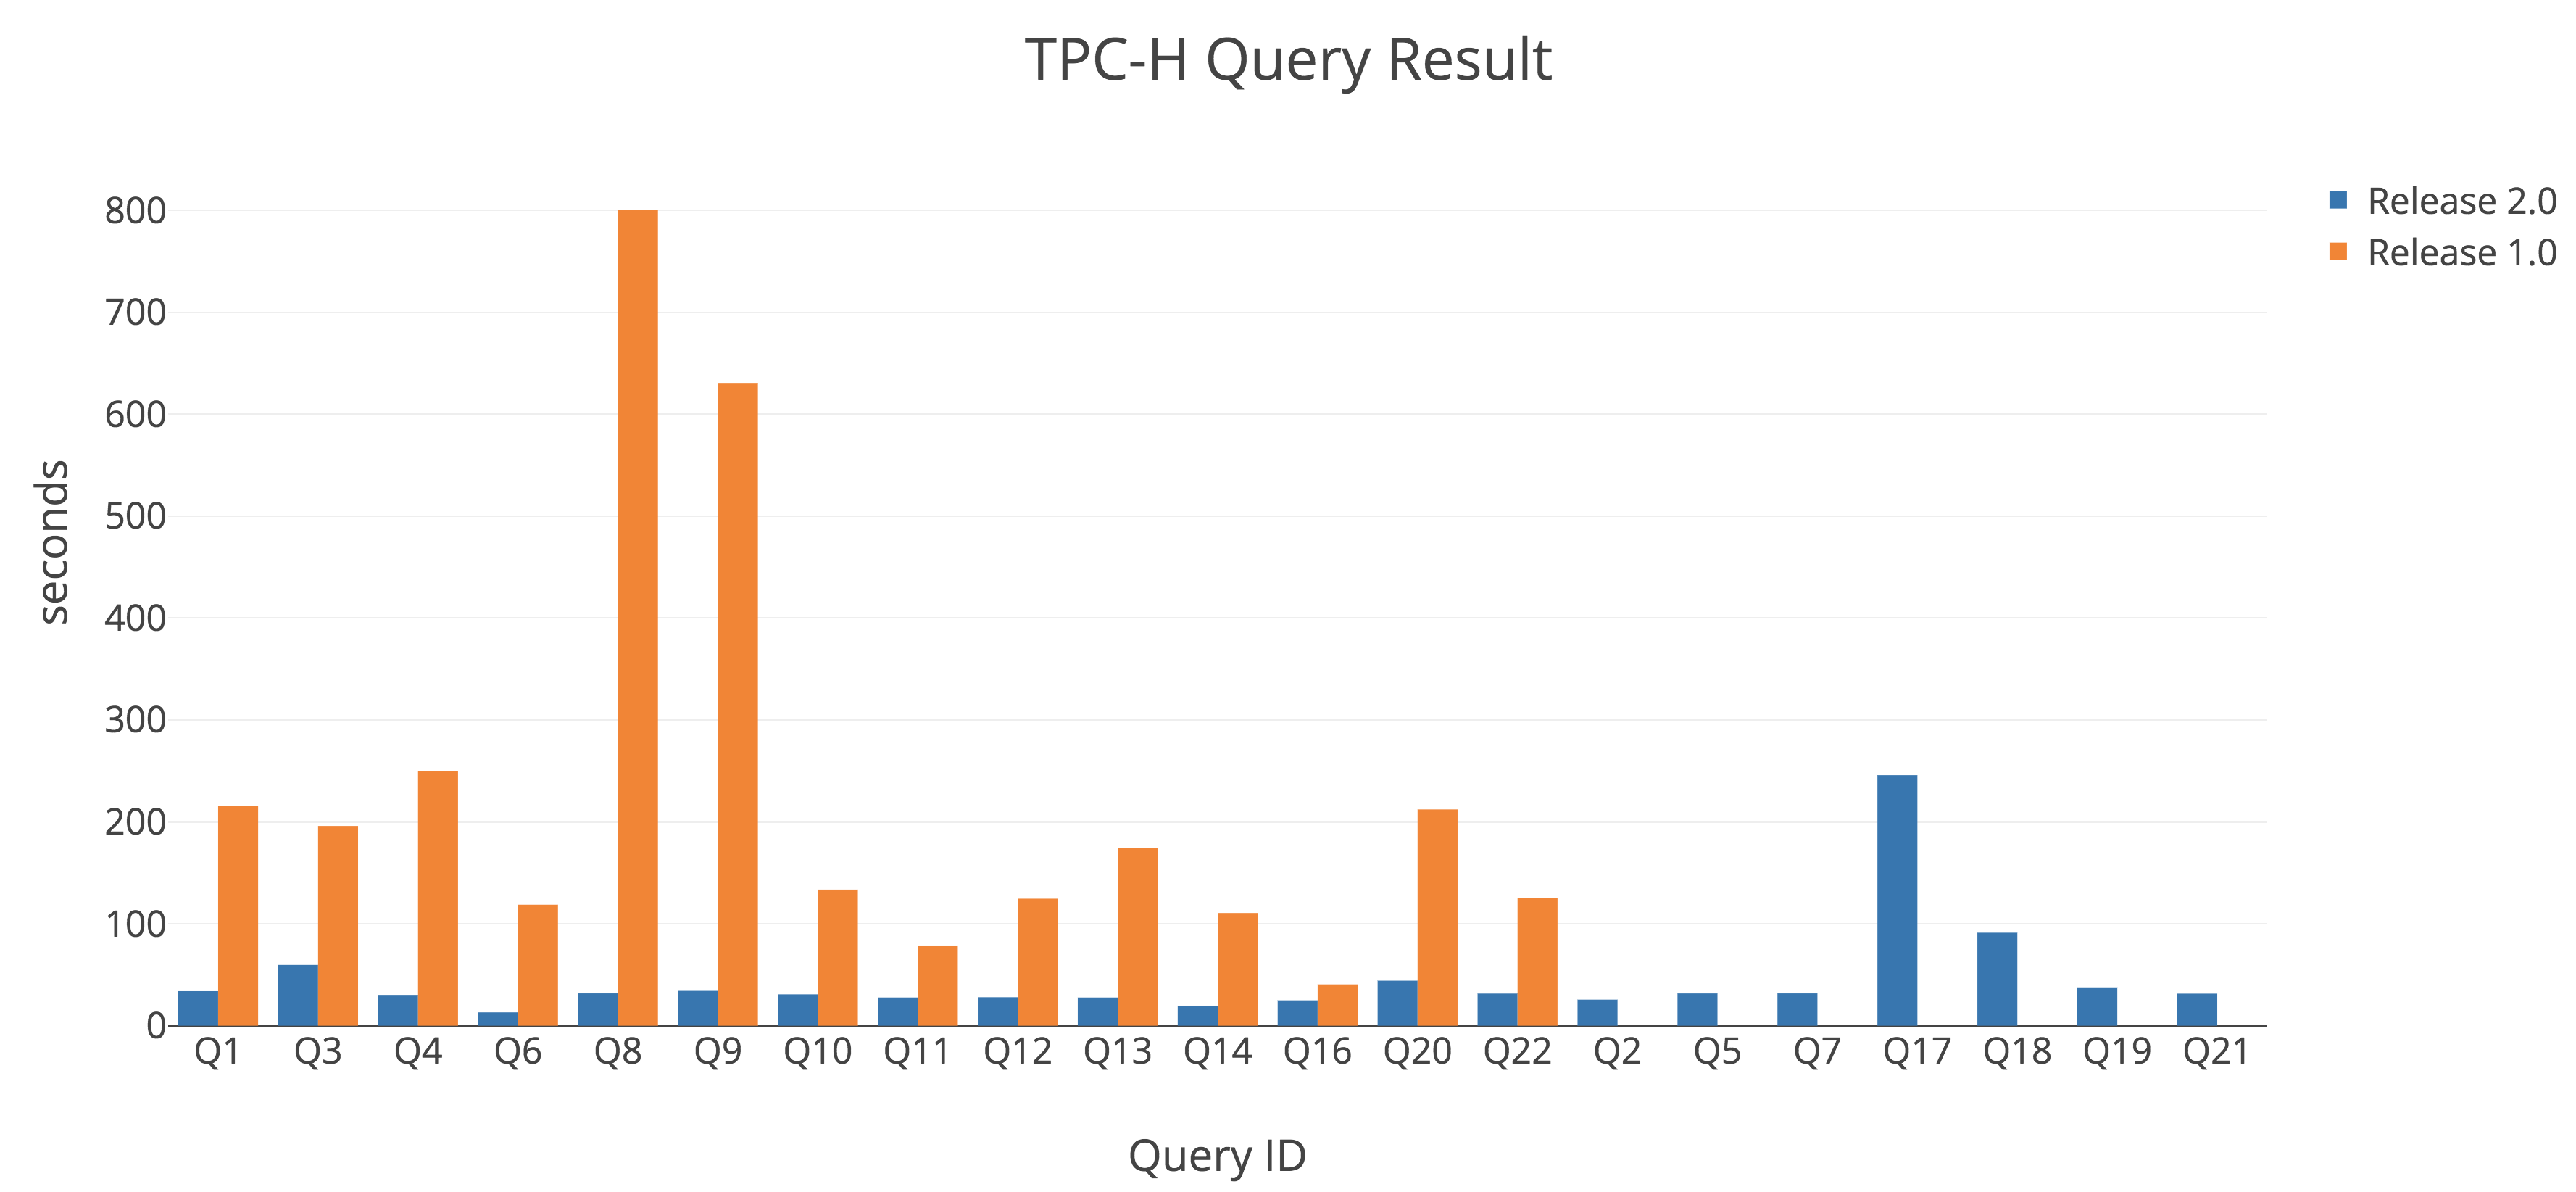
- In the diagram above, the orange bars represent the query results of Release 1.0 and the blue bars represent the query results of Release 2.0. The y-axis represents the processing time of queries in seconds, the shorter the faster.
- Query 15 is tagged with "NaN" because VIEW is currently not supported in either TiDB 1.0 or 2.0. We have plans to provide VIEW support in a future release.
- Queries 2, 17, and 19 in the TiDB 1.0 column are tagged with "NaN" because TiDB 1.0 did not return results for these queries.
- Queries 5, 7, 18, and 21 in the TiDB 1.0 column are tagged with "OOM" because the memory consumption was too high.